(Difference between revisions)
| Revision as of 13:51, 16 June 2006 Peter (Talk | contribs) (→'''A station-based network: step by step''') ← Previous diff |
Revision as of 13:52, 16 June 2006 Peter (Talk | contribs) (→'''A station-based network: step by step''') Next diff → |
||
| Line 52: | Line 52: | ||
| '''Step 2. Entering station data''' | '''Step 2. Entering station data''' | ||
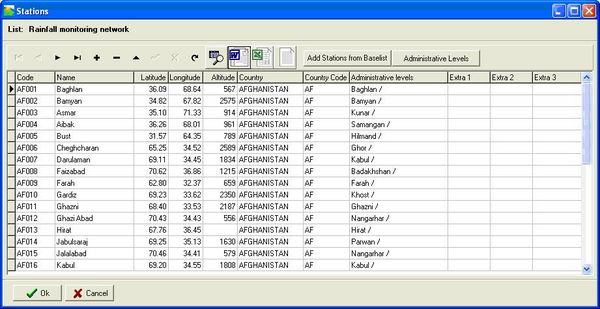
| - | In Agrometshell activate the “Database – Manage Station Lists” function, select <Create new list> and specify the name for the new list E.G. “crop monitoring network”. Press OK. A window will appear in which to enter the names of the new stations and all the attributes. In the first column the code of the station is specified. The second column specifies the station name. The third column specifies the latitude, the fourth the longitude, the fifth the altitude. The next three columns enable the user to specify the country and the administrative levels from “pick lists”. After entering all the stations the screen should look like this in screen 2. | + | In Agrometshell activate the “Database – Manage Station Lists” function, select <Create new list> and specify the name for the new list E.G. “crop monitoring network”. Press OK. [[Image:graph9.jpg|thumb|Screen 3: Viewing the station map|600px|right]] |
| + | A window will appear in which to enter the names of the new stations and all the attributes. In the first column the code of the station is specified. The second column specifies the station name. The third column specifies the latitude, the fourth the longitude, the fifth the altitude. The next three columns enable the user to specify the country and the administrative levels from “pick lists”. After entering all the stations the screen should look like this in screen 2. | ||
| '''Step 3. Viewing a station map''' | '''Step 3. Viewing a station map''' | ||
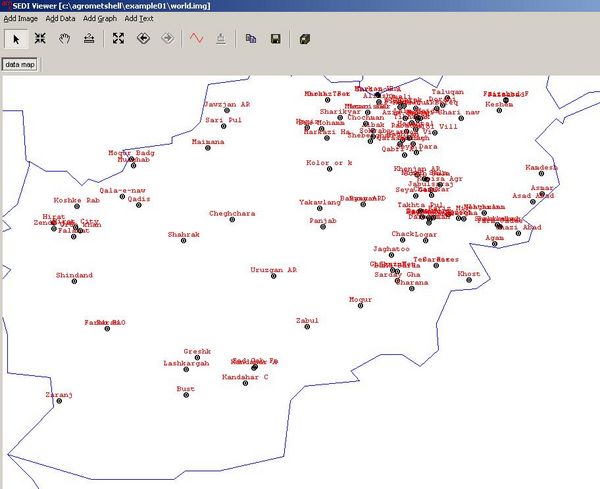
| Activate the ''Database-Map'' function. Specify "Station Name" at the second option and press <Ok>. The map station map appears (screen 3). | Activate the ''Database-Map'' function. Specify "Station Name" at the second option and press <Ok>. The map station map appears (screen 3). | ||
| - | |||
| - | [[Image:graph9.jpg|thumb|Screen 3: Viewing the station map|600px|right]] | ||
| </blockquote> | </blockquote> | ||
Revision as of 13:52, 16 June 2006
Setting up the monitoring network
Before setting up a monitoring network a decision has to be made on the type of network that is appropriate for the country or region at hand. This chapter outlines the practical steps to set up such a network given the choice made in the previous chapter.
Introduction to a station-based network
Most countries have an extensive network of meteorological stations. The most important types of monitoring stations are :
- Synoptic stations. These stations provide hourly data on a real-time basis. Usually these data are fed into the global GTS system of WMO. Most of these stations provide weather data that enable users to calculate the Penman-Monteith reference evaporation (ET0). A subset of these stations do upper-air observations, which is less interesting for agrometeorological purposes.
- Realtime Rainfall stations. These stations monitor rainfall and send in their data to the National Meteorological Office once a day.
- Off-line rainfall stations that send in their daily data once a month or even once a year. These stations are important for climatic studies and the provision of normal data.
Which stations are to be included in the crop monitoring network?
Although the selection criteria differs from countrry to country a few guidelines are universal:
- The station should be in an area where the monitoring crops are located.
- A reasonably stable stream of data on de decadal basis (or daily, hourly basis) should reach the crop forecasting unit.
- Stations should be evenly spread in crop growing areas. It does not make sense to include five stations in a 10 by 10 kilometer area (this is often the case in a capital city)
- To monitor crops in a water balance model, the following data are needed for the selected stations:
- Rainfall (actual and normal)
- PET (Potential evapotranspiration)
- Crops (which crops are planted and where they can be found)
- Planting dates for crops (PLD)
- Cycle length for all the crops (CYC)
- Water Holding Capacity (WHC) of the soil.
- Percentage Effective Rainfall (EFR)
- Pre-season Crop coefficient (usually around 0.15)
- Irrigation data including bund height (when applicable).
A station-based network: step by step
The following fields for every station are needed:
- ID (national or international number)
- Name (spelling is sometimes an issue)
- Longitude
- Latitude
- Altitude
- Province (optional)
- District (optional)
Step 1. Entering administrative areas
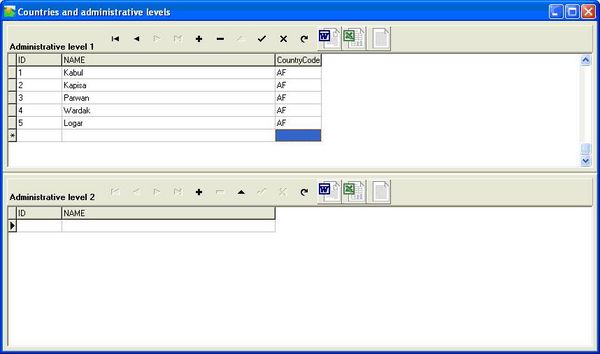
Most countries are subdivided in provinces and districts although the names for the administrative units may differ. Start AgrometShell. Open the menu item “Database – Manage Stations”. Press the “Administrative Levels” – button at the top of the screen. Screen 1 will appear. The top part enables the entry of provinces (administrative level 1), the bottom part is for the entry of administrative level 2 (districts) corresponding with the province.
The country codes used can be found here: Country codes
In this step we will start setting up the “rainfall monitoring network” list. Perform the following steps:
Step 2. Entering station data
In Agrometshell activate the “Database – Manage Station Lists” function, select <Create new list> and specify the name for the new list E.G. “crop monitoring network”. Press OK.A window will appear in which to enter the names of the new stations and all the attributes. In the first column the code of the station is specified. The second column specifies the station name. The third column specifies the latitude, the fourth the longitude, the fifth the altitude. The next three columns enable the user to specify the country and the administrative levels from “pick lists”. After entering all the stations the screen should look like this in screen 2.
Step 3. Viewing a station map Activate the Database-Map function. Specify "Station Name" at the second option and press <Ok>. The map station map appears (screen 3).


