(Difference between revisions)
| Revision as of 13:31, 8 September 2006 Peter (Talk | contribs) ← Previous diff |
Revision as of 13:32, 8 September 2006 Peter (Talk | contribs) Next diff → |
||
| Line 5: | Line 5: | ||
| The yield function is valid for a crop and a group of stations in an homogeneous cropping area. The input data correspond to different geographical units, from weather stations, to pixels (NDVI, CCD: 50 km2) to administrative units. It is an important step in the forecasting method to convert the data to comparable units (area averaging), usually administrative areas that are used by planners or decision makers in the field of food security. | The yield function is valid for a crop and a group of stations in an homogeneous cropping area. The input data correspond to different geographical units, from weather stations, to pixels (NDVI, CCD: 50 km2) to administrative units. It is an important step in the forecasting method to convert the data to comparable units (area averaging), usually administrative areas that are used by planners or decision makers in the field of food security. | ||
| - | Below is a very simple example of a yield function in an area where yields are mainly conditioned by limited water supply, as is the case -by definition- in most semi-arid areas of the world. | ||
| + | {|"class=prettytable" cellpadding="15" border="1" style="border-collapse:collapse" | ||
| + | |width="225"|Besides is a very simple example of a yield function in an area where yields are mainly conditioned by limited water supply, as is the case -by definition- in most semi-arid areas of the world. ||[[Image:graph80.jpg|400px|]] | ||
| + | |} | ||
| Regression lines similar to the one above have been used to prepare the yield maps shown in the following Outputs section | Regression lines similar to the one above have been used to prepare the yield maps shown in the following Outputs section | ||
Revision as of 13:32, 8 September 2006
Yield function
The yield function is a statistically derived function relating the water balance parameters (which constitute the outputs of the "agmet model") and the other factors (farm inputs, trend) or NDVI with station yield.
The yield function is valid for a crop and a group of stations in an homogeneous cropping area. The input data correspond to different geographical units, from weather stations, to pixels (NDVI, CCD: 50 km2) to administrative units. It is an important step in the forecasting method to convert the data to comparable units (area averaging), usually administrative areas that are used by planners or decision makers in the field of food security.
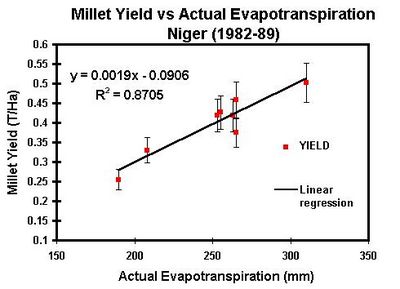
| Besides is a very simple example of a yield function in an area where yields are mainly conditioned by limited water supply, as is the case -by definition- in most semi-arid areas of the world. | 
|
Regression lines similar to the one above have been used to prepare the yield maps shown in the following Outputs section
