(Difference between revisions)
| Revision as of 17:02, 16 September 2006 Peter (Talk | contribs) (→Step 2. Performing the Linear Regression Analysis) ← Previous diff |
Revision as of 17:05, 16 September 2006 Peter (Talk | contribs) (→Step 2. Performing the Linear Regression Analysis) Next diff → |
||
| Line 49: | Line 49: | ||
| {|"class=prettytable" cellpadding="15" border="1" style="border-collapse:collapse" | {|"class=prettytable" cellpadding="15" border="1" style="border-collapse:collapse" | ||
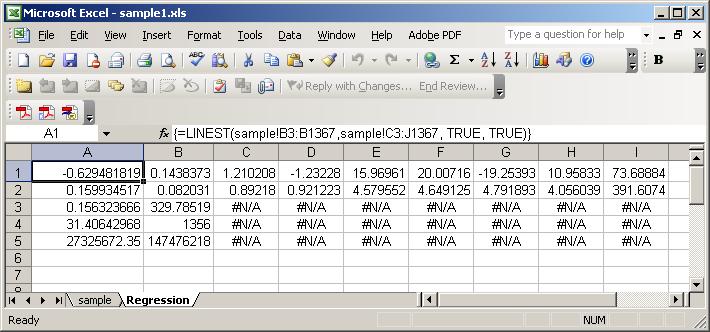
| - | |width="300"|The multiple regression is done in Excel. First the columns are deleted that are no longer needed. The file is saved under another name to prevent data loss.||[[Image:graph98.jpg|400px|]] | + | |width="300"|The multiple regression is done in Excel. First the columns that are no longer needed are deleted. The file is saved under another name to prevent data loss (sample1.xls).||[[Image:graph98.jpg|400px|]] |
| |---- | |---- | ||
| - | |width="300"|All parameters are selected.||[[Image:graph99.jpg|graph94.jpg]] | + | |width="300"|A second worksheet is created to hold the regression parameters. An array formula is entered : |
| + | <blockquote> | ||
| + | =LINEST(sample!B3:B1367,sample!C3:J1367, TRUE, TRUE)</blockquote> | ||
| + | The regression parameters are calculated. | ||
| + | |||
| + | ||[[Image:graph99.jpg|graph94.jpg]] | ||
| + | |||
| + | |||
| |---- | |---- | ||
| |width="300"|The output log file gives the most valuable results. The first, second and third component explains over 50% of the variance. The equation will be based on those 3 components.||[[Image:graph100.jpg|400px|]] | |width="300"|The output log file gives the most valuable results. The first, second and third component explains over 50% of the variance. The equation will be based on those 3 components.||[[Image:graph100.jpg|400px|]] | ||
Revision as of 17:05, 16 September 2006
Calibrating Yield
The yield function is a statistically derived function relating the water balance parameters (which constitute the outputs of the water balance model) and the other factors (farm inputs, trend) or NDVI with station yield. Once this function has been established, it can be used for early crop yield forecasting.
Although many different equations are possible, the most widely used one is the outcome of a multiple linear regression procedure:
Y = a + b1X1 + b2X2 + b3X3where b1 to b3 are the corresponding X coefficients.
Using an example for Malawi, first it will be established which water balance parameters are good predictors for yield. Then the multiple linear regression will be performed.
The input data file for Malawi contains multiple lines for stations and years. In every line, besides yield, all possibly relevant water balance output parameters are stored. The file can be downloaded here 
Step1. Finding the relevant parameters with a principle component analysis
Step 2. Performing the Linear Regression Analysis


