Revision as of 18:48, 10 June 2006; view current revision
←Older revision | Newer revision→
Chapter 3. Presentation of Potential Evapotranspiration (PET) and its role in the calculation of crop water budgets and crop forecasting
Crop water use
Evapotranspiration is the combination of two separate processes whereby water is lost on the one hand from the soil surface by evaporation and on the other hand from the crop by transpiration. During the crop season the crop canopy will increase. This is usually expressed through the Leaf Arae Index (LAI). This denotes the number of times that the total leaf surface area of the crop exceeds the ground area the plants cover. A typical course of the LAI during the season can be seen in the graph below.

During the season the relative importance of evaporation of the soil decreases versus the crop transpiration.
Relation between crop water use and yield
Doorenbos and Kassam outlined in their FAO publication “Yield response to water” that there is a clear relation between crop yield and water use. This relation is the basis of the use of a water balance calculation in crop forecasting. It is possible to establish a maximum yield (Ym) based on a season without water stress and water deficit. The total evapotranspiration is then at his maximum (ETm). In semi-arid circumstances yield is usually reduced due to water stress leading to a lower actual yield (Ya) and lower evapotranspiration (ETa)
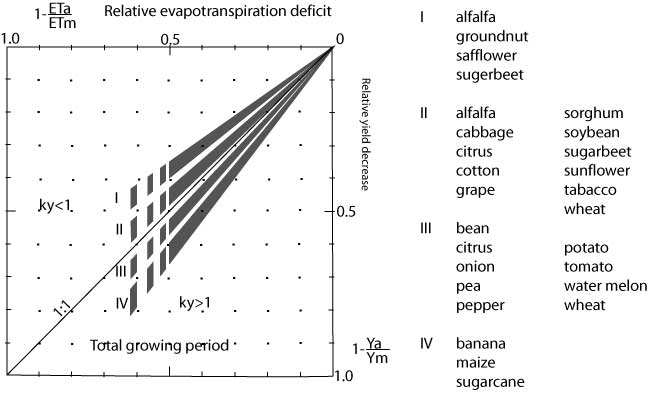
The authors introduced the so-called yield response factor (ky) to explain the yield reduction due to water stress. They established the yield response factor for a large number of crops in a limited number of climates. Doorenbos and Kassam found this relation to be near-linear for most crops (see graph). The general formula is:
(1- Ya/Ym) = ky * (1 - ETa/ETm)
The graph below establishes the relationship for a number of crops.
Actual and reference evapotranspiration
Summarizing, crop yield can be estimated by measuring actual evapotranspiration. The only reliable way of measuring actual evapotranspiration is to use large containers (sometimes on the order of several metres across) called lysimeters, evaluate the different components of the water balance precisely, and calculate the evapotranspiration by subtraction.
Installing lysimeters is vast quantities is impractical, but through the work of Penman (1948) and Monteith (1980). Through experimentation Penman found that that it was possible to calculate a “crop neutral” reference evapotranspiration (ET0) based on 4 basic meteorological parameters:
- Wind
- Solar radiation
- Temperature
- Humidity
Some of these input 4 parameters can be estimated from others. Many meteorological stations around the world measure these parameters making it possible to calculate ET0.
Reference evapotranspiration (ETo or sometimes referred to as potential evapotranspiration) is defined as the evapotranspiration from a 10cm tall grass that completely covers the ground, and is supplied with adequate water. Many scientists refined Penman’s work. FAO has standardized on the adaptations by Montheith (1980).
An example : calculating the ET0 in AgrometShell.
Crop coefficients
The relation between actual and reference evapotranspiration and actual evaporation in the field is based on crop coefficients. ETa is determined by the crop coefficient approach whereby the effect of the various weather conditions are incorporated into ETo and the crop characteristics into the Kc coefficient:
ETa = Kc * ETo
The effect of both crop transpiration and soil evaporation are integrated into a single crop coefficient. In other words, the Kc coefficient incorporates crop characteristics and averaged effects of evaporation from the soil.
Crop coefficients (Kc) are dependent on: • Crop • Phenological stage of the crop (planting, vegetative phase, yield formation, ripening etc..) • Soils, climate etc. Crop coefficients are known to be slightly different for different parts of the world.
An example : examining the crop coefficients implementing in AgrometShell.
Using the “Database – Configure - Crop Coefficients“ of Agrometshell the crop coefficients can be viewed and (if needed) adapted to local circumstances.
In this screen the crop coefficients are defined per crop and phenological phase. Different sets of coefficients can be defined per crop. Rather than working with fixed crop cycles, this screen defines the coefficnts for a certain % of crop cycle. The left set of the window allows manipulation of the curve on the right side.


